
Thinking Maps
What Are Thinking Maps?
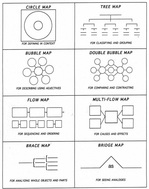
Thinking Maps are eight specific visual patterns
Visualizing our thinking allows us to have a concrete image of our abstract thoughts. Visual representations enhance the brain's natural ability to detect and construct meaningful patterns. Thinking Maps reduce anxiety by providing familiar visual patterns for thinking and working with complex ideas and situations.
Research: "Although thinking is innate and spontaneous, skillful thinking must be cultivated." -Art Costa, The Thought-Filled Curriculum
Thinking Maps® (Innovative Learning Group) integrate thinking skills and mapping techniques. Learning to use these strategies helps students develop good writing skills. These techniques also help students become better learners as they develop life-long skills that help them to study.
Thinking Maps® uses basic mental operations involved in perceiving, processing and evaluating information. They describe, classify, and sequence.
The skills used with Thinking Maps® can be done with paper and pencil and many writing activities begin with a Thinking Map®. To follow are examples using the Thinking Maps® software.
Types of Maps
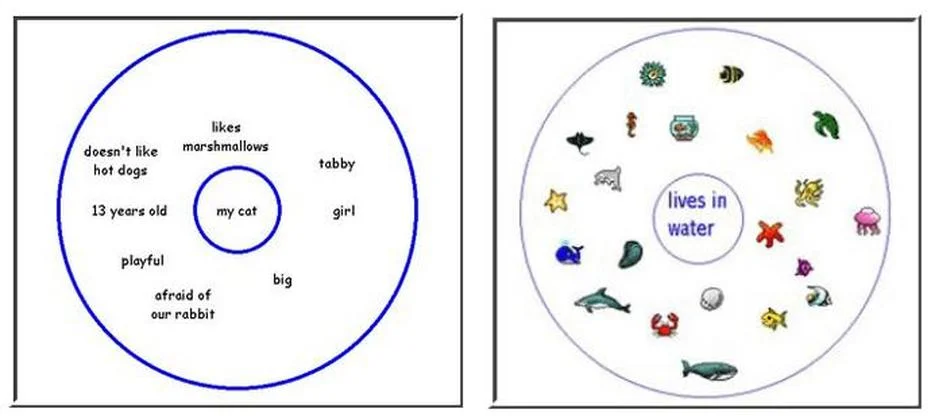
Circle Map®
Circle Maps are tools used to help define a thing or idea. It is used to brainstorm ideas and for showing prior knowledge about a topic. In the center of the circle, use words, numbers, pictures, or any other sign or symbol to represent the object, person, or idea you are trying to understand or define. In the outside circle, write or draw any information that puts this thing in context.
Bubble Map®
Bubble Maps are used to describe qualities using adjectives ("sparkle words") and adjective phrases. As a writing tool it enriches students' abilities to identify qualities and use descriptive words. In the center circle, write the word or thing being described. Write the adjectives or adjective phrases in the outside circles.

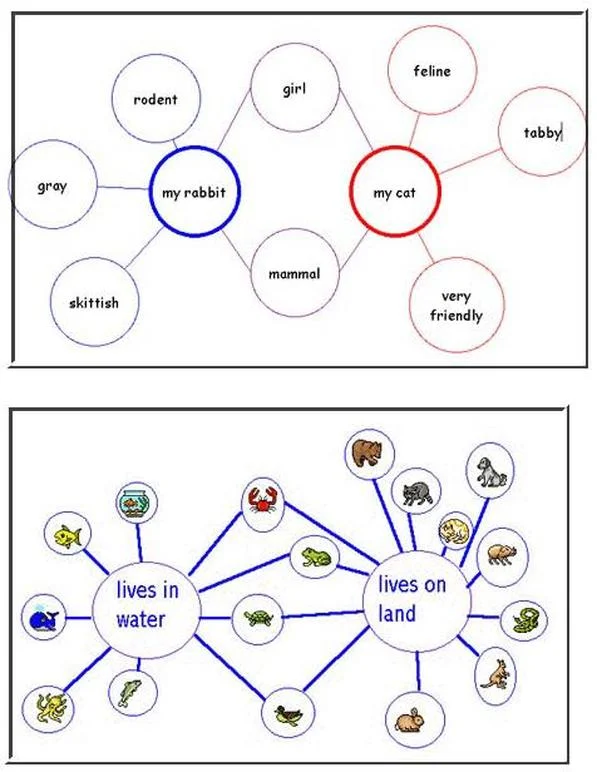
Double Bubble Map®
When comparing and contrasting, we use Double Bubble Maps. This is similar in concept to a Venn Diagram. Two items being compared are written in the two center circles. Outside bubbles show items that share qualities with only one object - these are contrasting qualities. Center bubbles (that connect to both circles) show similarities between the two items being compared.
Tree Map®
For classifying and grouping, students learn to use a Tree Map. Things or ideas are sorted into categories or groups. Sometimes new categories are created. On the top line, write the category name. Below that begin writing sub-categories. Below each sub-category write specific members of the group. Some things can go in multiple groups.
Tree Maps are good for studying for tests. Use this map to categorize spelling words according to the skill being taught. Try using a Tree Map when studying Social Studies or Science.

Brace Map®
Brace Maps help learners understand the relationship between a whole physical object and its parts. They are used to analyze the structure of an item. It's like 'directing' on paper.
On the line to the left, write the name of the whole object. On the lines within the first brace to the right, write the major parts of the object, then follow within the next set of braces with the subparts of each major part.
Tree Maps are good for organizing the agenda of a meeting or showing the structure of an organization.

Flow Map®
Flow Maps sequence and order a process. They identify the relationships between stages and substages of an event (or order or numbers, operations, steps, etc.) They can be used to explain the order of events.
In the outside rectangle, write the name for the event or sequence. Rectangles to follow list the steps or events that follow from beginning to end. Smaller rectangles may be written below to list substages or each major stage.
Multi-Flow Map®
Cause and effect is represented in a Multi-Flow Map. It is a process of sequencing that looks at what caused an event and the results/effects of the event. It helps students analyze a situation by looking at the cause and effect - the 'why' and 'consequences' - good or bad.
In the center rectangle, list the event that occurred. In the rectangle to the left, list the causes of the event. Write the effects/consequences of the event in the rectangles to the right of the center rectangle. If you are studying a system, you will find that there are effects in the system which, in turn, influence initial causes. This circular cause and effect relationship is called a feedback loop.

Bridge Map®
Seeing analogies is the process of identifying similarities between relationships. These are similar to the 'analogies' found on SATs with one difference being Bridge Maps can have many 'bridges'.
Bridge Maps give students a tool for applying the process of seeing analogies. On the far left, write in the relating factor. The relating factor is the similar phrase that fits both sides of an analogy. On the top and bottom of the left side of the bridge, write in the first pair of things that have this relationship. On the right side of the bridge, write in the second pair of things that have the same relationship. The bridge can continue with more relating factors.
Innovative Learning Group copyright Statement: The term "Thinking Maps" and the graphic form of the eight Maps have registered trademarks. The term "Thinking Maps" with or without the graphic form of the eight Maps may not be used in any way without the permission of Innovative Sciences, Inc. For more information, visit their website at www.thinkingmaps.com.